There seems to be an evolutionary advantage to being able to spot small changes in the natural world. For example, the Australian amateur astronomer Bob Evans has such an incredible knack for spotting minute changes in the night sky that he holds the record for visual discoveries of supernovae. But paradoxically, it means that we tend to misinterpret rates-of-change. We find it hard to differentiate between relative and absolute changes, and do not intuitively extrapolate non-linear systems accurately. In various experiments, Sterman and others have shown that people tend to misinterpret system dynamics problems, such as carbon accumulation, and the fluid balance of bodies. Even science college students find it difficult to grasp simple stock-flow-change examples. The problem stems from a misunderstanding of the principles of accumulation.
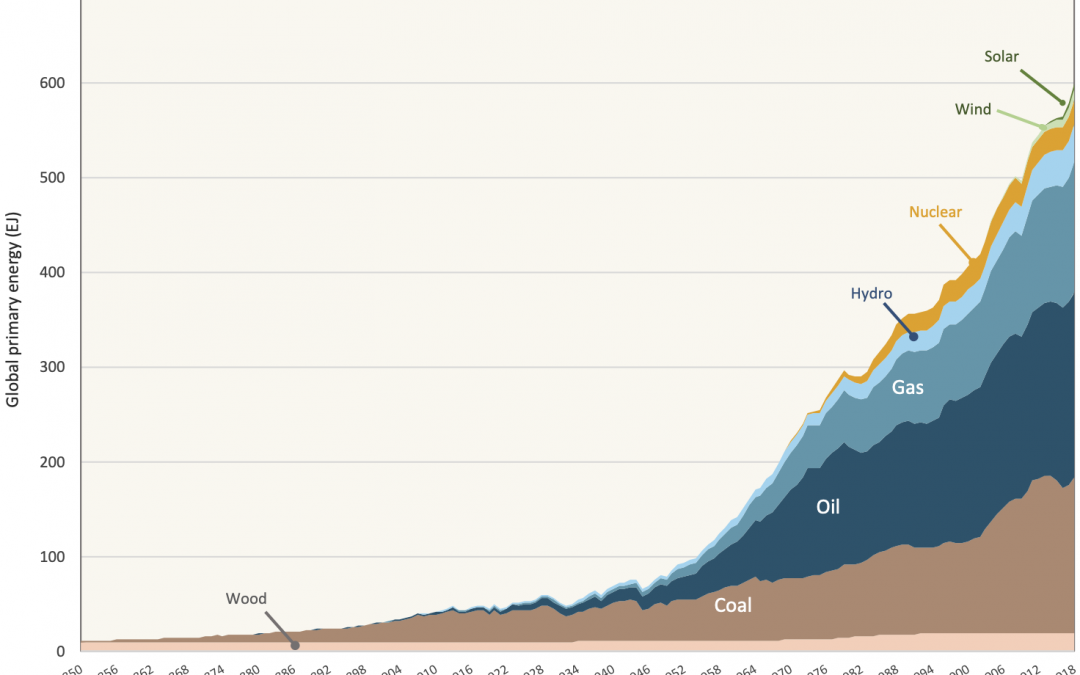
The optimism bias of Greentech enthusiasts is an example of a tendency to translate trends in renewable growth to total energy supplied. Many Greentech enthusiasts seem bemused when confronted with the reality that ‘new’ renewables make up such a small proportion of global primary energy. Similarly EV proponents tend to conflate growth in EV sales to EV penetration as a proportion of total vehicle stock, not readily seeing that strong sales growth will take 10 to 20 years to translate to a large share of the total vehicle stock.
Similarly with COVID-19, mathematicians and scientists seem comfortable with thinking about exponential growth and what it means, but this comes from years of working with hard data. I think it is clear that the human brain is not wired to think in exponential terms. Survival demands reacting to changes in the environment, but instinctively understanding exponential growth is not part of our survival kit. Hence it is not surprising that it has taken people some time to come to grips with the scale of the problem that COVID-19 presents – infection rates are reported to exhibit a doubling time of days or weeks – much faster than the doubling times of emerging energy technologies which are of the order of years.
Figure above from Energy Storage and Civilization, Palmer & Floyd. Stacked graph of global primary energy 1850–2018. Hydro, nuclear, wind and solar shown with primary energy substitution (quality) factor of 2.6


Recent Comments